Now I will look at a few selected players' career totals, in a few different categories: no-doubt hall of fame type players (Willie Mays, Hank Aaron, Frank Robinson, Mickey Mantle, Rickey Henderson, Barry Bonds); mid-level hall of fame types (Cal Ripken, Pete Rose, Robin Yount, Paul Molitor); borderline cases from the last few years (Craig Biggio, Jim Rice, Andre Dawson, Kirby Puckett); and current players who I think might be interesting (Albert Pujols, Miguel Cabrera, Vernon Wells, Adrian Beltre, Adam Dunn). I will then pick a couple of comparable pitchers based on their real win-loss records.
Let's start with the all time stat-masters.
Willie Mays (322-131)
Comparable pitchers: Lefty Grove (300-141). I think we are going to be seeing a lot of Lefty with this group.

Hank Aaron (358-161)
Comparable pitchers: Lefty Grove (300-141), Randy Johnson (303-166), Roger Clemens (354-184)

Barry Bonds (362-103)
Comparable Pitchers: None, but for the sake of argument, the same as above. The totals are split into pre-PED Barry 1986-1998 RIP, and PED Barry 1999-2007. Pre-PED Barry went 222-83, comparable to real person Pedro Martinez (219-100). PED Barry went 139-19. He broke baseball. The closest comparisons in the last 50 years are Justin Verlander (136-75) and Johan Santana (139-78), who both have more than 3 times as many losses as PED Barry.

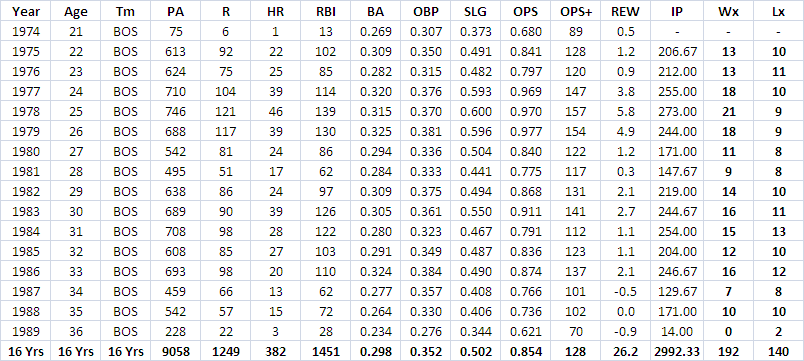
Rickey Henderson (300-170)
Comparable pitchers: Randy Johnson (303-166)

Frank Robinson (296-133)
Comparable pitchers: Lefty Grove (300-141). I'm thankful Grove exists for this group.

The point of doing this with pitchers was to remove the luck of team performance from the W-L equation. We maintained luck from individual performance though - depending on the base/out situation, the same hits are worth different values of REW. But overall, we have reduced luck so we expect there to be fewer outliers. We see here that legendarily good players don't have bad seasons, except maybe at the tail end of their careers. There is more consistency to won loss records.
However, I do think that converting to these numbers helps to identify great seasons from good seasons in an accessible way. 16-11? Good season. 19-7? Great season! 21-7? Incredible season! 23-0? Nope, that's not allowed because then baseball is broken.
In these greatest of great players, there is also a limit to the degree with which actual pitching records match up. And I think that this is okay. Willie Mays's 322-131 Wx-Lx record is unparalleled by pitchers, which makes some sense to me. I am okay saying that his career was better than any of theirs, that he contributed more to wins and less to losses than any pitcher. He was a terrific baseball player who played every day.
Now let's look at some solid hall of fame types*.
*I have to write types because I want to include Pete Rose.
Cal Ripken (261-230) - Remember that a lot of Cal's defensive value is not presented here.
Comparable pitchers: Ted Lyons (260-230), Jim Kaat (283-237), Fergie Jenkins (284-226)

Pete Rose (369-247)
Comparable Pitchers: Warren Spahn (363-245), Greg Maddux (355-227), Steve Carlton (329-244)

Robin Yount (258-201)
Comparable Pitchers: Jack Morris (254-186), Jamie Moyer (269-209), Dennis Martinez (245-193)

Paul Molitor (266-185)
Comparable pitchers: Jack Morris, (254-186), Bob Feller (266-162), Bob Gibson (251-174), Dennis Martinez (245-193)

With these players, it becomes clear that this statistic does not capture defence. So, for players whose value is primarily derived from defence, their Wx-Lx record is not going to shine. Other than one spectacular season and two or three more very good seasons, Cal Ripken was a .500 player, by this measure. Which we know is not really true - but it's because this metric does not take into account that he played a good shorstop and then probably an adequate third base. I wasn't going to add any more players, but now I want to look at both Brooks Robinson and Ozzie Smith, two hall of famers who would not be there without a significant defensive contribution.
I wanted to include Pete Rose because he leads all time in things like games played and plate appearances, which in this case is analogous to leading in "innings pitched" and therefore number of decisions. While he does not approach Walter Johnson / Cy Young territory, he is in the tier below in terms of decisions with his comparables. I think it makes sense. He was a great player for a long time, and a good player for a long time, and if nothing else, he is known for (as a batter/baserunner) doing whatever it took to win - what RE24 tries to identify.
The comparables I chose for Yount and Molitor show, I think, that with pitching wins and losses, it matters how you got those wins. Gibson and Feller won dominantly; Dennis Martinez and Jack Morris, less so. Which makes me interested now in career Wx-Lx for some pitchers, and how far off these would be from their actual W-L. I smell another post on this theme.
Here is Brooks Robinson (225-208)
Comparable pitchers: Jerry Koosman (222-209), Joe Niekro (221-204), Mickey Lolich (217-191)

And Ozzie Smith (197-192)
Comparable pitchers: Claude Osteen (196-195), Tim Wakefield (200-180), Doyle Alexander (194-174)

Okay, we will move now to some more borderline hall of fame cases. At least I think they are more borderline, or have been considered borderline.
Craig Biggio (275-202) - he is here because he has been labelled a "compiler", but I think he is better than that.
Comparable pitchers: Jamie Moyer (269-209), Tom Glavine (305-203), Burleigh Grimes (270-212)

Jim Rice (192-140)
Comparable pitchers: Dwight Gooden (194-112), David Cone (194-126), Mark Buehrle (185-139)
Andre Dawson (217-161)
Comparable pitchers: Kenny Rogers (219-156), Curt Schilling (216-146), Catfish Hunter (224-166), John Smoltz (213-155)

Kirby Puckett (178-124)
Comparable pitchers: Dave Stieb (176-137), Bartolo Colon (185-128), Rube Waddell (178-127), Dave Stewart (168-129)

I'm not sure if this is a case FOR their comparables to be in the HOF, or if it is more of a case against their inclusion. By this standard, Biggio looks more like he belongs in the hall. Puckett was lucky he got in before of all of his PR mess.
Now for the modern players, who are not finished quite yet*.
*I would argue that Vernon Wells is finished.
Albert Pujols (233-98):
Comparable pitchers: Whitey Ford (236-106), Pedro Martinez (219-100)

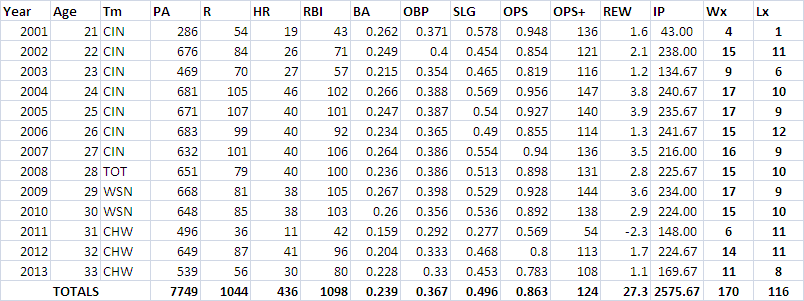
Miguel Cabera (182-87):
Comparable Pitchers: Ron Guidry (170-91), Pedro Martinez (219-100), Sandy Koufax (165-87)

Vernon Wells (130-124):
Comps: Cy Falkenberg (130-123), Pedro Astacio (129-124), Jon Lieber (131-124), Darryl Kile (133-119)

Adrian Beltre (183-156):
Comps: Mark Buehrle (185-139), Mark Langston (179-158), Derek Lowe (176-157). Remember that Beltre has produced a lot of his value defensively - I am underwhelmed by these numbers.

Adam Dunn (170-116):
Comps: Bret Saberhagen (167-117), Rube Waddell (178-127), Bartolo Colon (185-128)
Pujols and Cabrera don't really even have comparables, they are that good - and they are also at the mid-points of their careers, before the decline phase which we see in some of these other players. Adding 4-5 seasons of .500 or close to .500 records will make a lot more pitching comparisons accurate and reasonable.
I included Beltre because I thought he would have a surprisingly good record. He does not. I included Dunn because I thought he might be the equivalent of an innings eater. He wasn't - his Wx-Lx is actually good. This type of stat apparently likes his style of game - and doesn't take off points for his baserunning or defence. Vernon was about what I expected. Some good seasons, some mediocre, .500 overall.
I could do this all day. And I might continue. But I think that is enough for now.
Hold on now!
ReplyDeleteYou are comparing adjusted batter stats to unadjusted pitcher stats.
No fair!!
:)