In any case, I think it's pretty interesting so I decided to write it up anyway.
There have been 21 perfect games in MLB history, and a surprising number of them have come in the last few seasons. But, there have also been 11 near-misses: perfect games through 26 batters that have failed. The most recent, and my inspiration, was Yu Darvish's season opener this year. On April 2, Darvish mowed through the first 26 Houston Astros, striking out 14 of them. On the 27th batter, he gave up a first pitch single and lost the perfect game (Texas won 7-0).
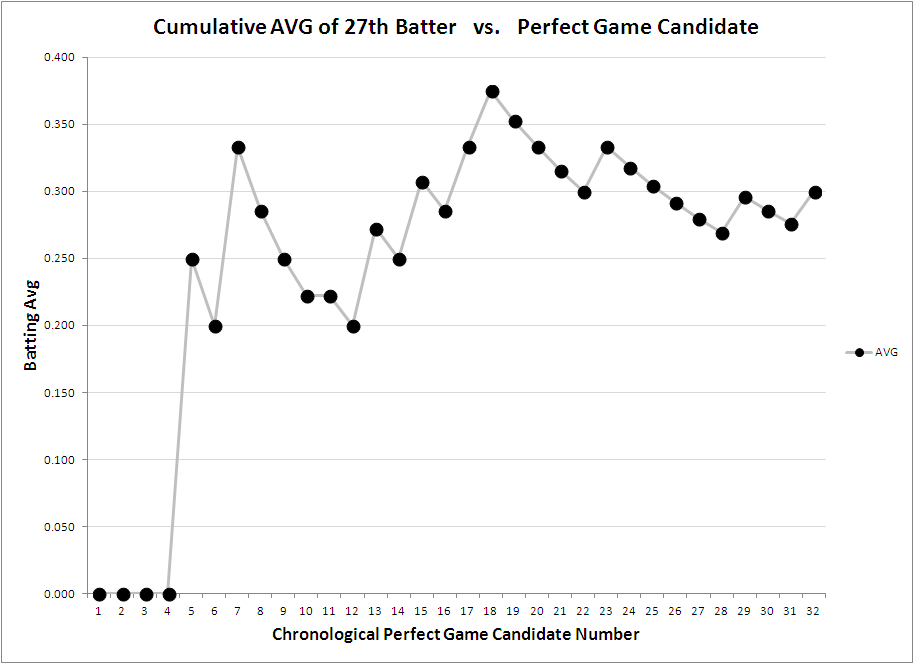
Before that game, there had been 31 perfect game candidates, 21 of which were completed. Going into that game, the 27th batter was hitting .276/.323/.448 - not bad. After that 1/1, the 27th batter of a perfect game is currently hitting a cumulative .300/.344/.467.


On April 20, 1990, Brian Holman of the Seattle Mariners gave up a home run to 27th batter Ken Phelps of the Oakland Athletics, which really impacts the slugging percentage of our 27th batter. Then again, 1 HR in 30 at bats is not far from the 2013 league average of 1 HR every 34.1 at bats.
For reference, the 2013 MLB average is .254/.317/.402. So, taken as a whole, the 27th batter is slightly *better than average* (small sample size alert!). Over 32 plate appearances, it's close enough, and I think we only have enough data, to say that the 27th batter of a perfect game is basically an average major league hitter.
Of course, we also all remember the 31st perfect game candidate - Armando Galarraga - losing his bid with 26 outs when umpire Jim Joyce famously blew a close call at first base, awarding the batter a free hit. Umpire mistakes are a part of baseball and certainly can occur in this situation, especially with so much pressure on the line. If Galarraga had actually completed his perfecto, the current batting line for the 27th batter would be an even more average-like .267/.313/.433. As you can see, with only 32 PA a single hit has a huge impact on the bottom line.
Between 1904 and 1922, the 27th batter started off his career cold, going 0/3 with a HBP in his first 4 PA (.000/.250/.000). From 1932 to 1990, the next 14 PA were scorching hot - .462/.500/.846! Over the last 23 years, the 27th batter has been in a bit of a slump, seeing the field more often (14 PA in only 23 years) but hitting only .214/.214/.214 with 3 singles. That's baseball.
Once we have had enough at bats for a full season of 27th batter, we can see if these "average batter" projections truly turn out to be reasonable. If the pace of the last 23 years keeps up, I will re-post the 600PA analysis in... 933 years. Peace out.
No comments:
Post a Comment